Difference between revisions of "A Layman's Guide - How to Get a Debug Log"
m (→NOTES for Unix users:) |
|||
| (28 intermediate revisions by 2 users not shown) | |||
| Line 1: | Line 1: | ||
| − | This guide will show you how to get a debug log | + | {{Laymans}} |
| + | This guide will show you how to get a debug log using the built in ReactOS debugger. There are several different ways to do this; they are: | ||
| + | |||
| + | [[#Through the serial port|Through the serial port.]] This is the best way; it captures all debug output from the moment it starts outputing. | ||
| + | |||
| + | [[#With a log file|With a log file.]] This is the least useful, due to the fact that it is saved to the hard drive and it first needs the OS to be installed. | ||
| + | |||
| + | [[#To the screen|To the screen.]] This is the second most useful way, you need to do some configuring to get debug info from the very start of stage one of the installation. | ||
| + | |||
| + | [[#In a virtual machine|In a virtual machine using com0com (Windows) or tty0tty (unix)]] This uses a software serial port and is the best way when using a virtual machine. | ||
| + | |||
| + | ==Section one - General information== | ||
===Debug ISOs=== | ===Debug ISOs=== | ||
| Line 12: | Line 23: | ||
reactos-livecd-0.4.7-dev-575-g48b2714-x86-msvc-win-dbg.7z | reactos-livecd-0.4.7-dev-575-g48b2714-x86-msvc-win-dbg.7z | ||
| + | |||
| + | reactos-livecd-0.4.15-dev-147-g633770a-x64-msvc-win-dbg.7z | ||
'''Explanation:''' | '''Explanation:''' | ||
| Line 32: | Line 45: | ||
For normal users, the ISOs built with '''gcc''' are the ones to go for. You may need a copy of MSVC to make full use of the '''msvc-win''' builds. | For normal users, the ISOs built with '''gcc''' are the ones to go for. You may need a copy of MSVC to make full use of the '''msvc-win''' builds. | ||
| + | |||
| + | '''x64''' = the 64 bit version. Only available (currently) from the '''Latest Builds''' page and they are of no real value yet. There are '''NO''' official '''Release''' builds yet. | ||
===Stages of the installation of ReactOS=== | ===Stages of the installation of ReactOS=== | ||
| Line 38: | Line 53: | ||
'''First stage:''' | '''First stage:''' | ||
| − | When the installation CD (bootcd) is run, the bootloader asks you to '''press any key to install''' | + | When the installation CD (bootcd) is run, the bootloader asks you to '''press any key to install'''. |
The OS will first load itself into memory, then you are presented with the '''Language''' setup window, then 2 more windows, then '''Device settings''' window, then choose '''Hard drive partition''' window, then '''format''' window, then '''confirm format''' window. then '''choose directory''' window. then 2 more windows, then '''bootloader choice''' window. In the last window you are asked to '''remove media and press Enter'''. The computer now reboots. | The OS will first load itself into memory, then you are presented with the '''Language''' setup window, then 2 more windows, then '''Device settings''' window, then choose '''Hard drive partition''' window, then '''format''' window, then '''confirm format''' window. then '''choose directory''' window. then 2 more windows, then '''bootloader choice''' window. In the last window you are asked to '''remove media and press Enter'''. The computer now reboots. | ||
| Line 54: | Line 69: | ||
Debug output only starts when the OS is loaded into memory, but just before it loads the drivers. | Debug output only starts when the OS is loaded into memory, but just before it loads the drivers. | ||
| − | When installing (First stage), debug output is turned on by default and can only be captured through a null modem serial cable connect to a second computer (see | + | When installing (First stage), debug output is turned on by default and can only be captured through a null modem serial cable connect to a second computer (to alter this default, see [[How_to_get_a_debug_log#Getting_debug_information_in_the_first_stage_of_installing_ReactOS_without_needing_a_serial_port | this section]]), but once ReactOS is installed (Second stage and normal usage), you will have a choice of how to record debug output, from the boot menu. See <sup>[<span style="color:#b60000">'''1'''</span>]</sup> '''ReactOS boot options menu''' in '''Screenshots''' section in '''Part two''' below. |
| − | ===Hardware requirements:=== | + | ==Section two - The different methods for getting a debug log== |
| + | |||
| + | ===Through the serial port=== | ||
| + | ====Hardware requirements:==== | ||
* A test computer with a serial port. | * A test computer with a serial port. | ||
* A second computer with a serial port and Putty installed (or similar app). | * A second computer with a serial port and Putty installed (or similar app). | ||
* A nullmodem cable to connect both computers. | * A nullmodem cable to connect both computers. | ||
| − | ===Software=== | + | ====Software==== |
Win32 Putty - http://www.chiark.greenend.org.uk/~sgtatham/putty/download.html You will also find the source code for Windows and Unix at this link, but Unix users may be able to get Putty through their Package Manager (see '''NOTES for Unix users'''). | Win32 Putty - http://www.chiark.greenend.org.uk/~sgtatham/putty/download.html You will also find the source code for Windows and Unix at this link, but Unix users may be able to get Putty through their Package Manager (see '''NOTES for Unix users'''). | ||
| − | ====Setting up Putty.==== | + | =====Setting up Putty.===== |
There are some vital settings in Putty, which need to be set, so that Putty can capture a debug log. | There are some vital settings in Putty, which need to be set, so that Putty can capture a debug log. | ||
In putty go to '''Category''' and select '''Session''', then set the following inputs to these values: | In putty go to '''Category''' and select '''Session''', then set the following inputs to these values: | ||
| Line 79: | Line 97: | ||
Save the above changes in putty, with a name of your choice, in '''Saved Sessions''', then use the '''Save''' button. It can then be loaded the next time you use Putty, by using the '''Load''' button. Note: logging is started by using the '''Open''' button. | Save the above changes in putty, with a name of your choice, in '''Saved Sessions''', then use the '''Save''' button. It can then be loaded the next time you use Putty, by using the '''Load''' button. Note: logging is started by using the '''Open''' button. | ||
| − | ====NOTES for Unix users:==== | + | =====Screenshots===== |
| + | |||
| + | <gallery widths="443px" heights="213px" paddings="0px"> | ||
| + | File:StartMenu.png|[<span style="color:#b60000">1</span>] ReactOS boot options menu. | ||
| + | </gallery> | ||
| + | <gallery widths="456px" heights="435px" paddings="0px"> | ||
| + | File:PuttyConf-1.png|[<span style="color:#b60000">2</span>] PuTTY Configuration - Session | ||
| + | File:PuttyConf-2.png|[<span style="color:#b60000">3</span>] PuTTY Configuration - Logging | ||
| + | </gallery> | ||
| + | <gallery widths="678px" heights="46px" paddings="0px"> | ||
| + | File:Debugger-1.png|[<span style="color:#b60000">4</span>] Ros in the debugger showing '''bt''' entered at the command prompt. | ||
| + | </gallery> | ||
| + | <gallery widths="579px" heights="17px" paddings="0px"> | ||
| + | File:Debugger-2.png|[<span style="color:#b60000">5</span>] You may see this after entering '''bt''' and after the debug info has stopped. | ||
| + | </gallery> | ||
| + | <gallery widths="445px" heights="48px" paddings="0px"> | ||
| + | File:Debugger-3.png|[<span style="color:#b60000">6</span>] The debugger has been entered manually and shows '''set condition '''*''' first always''' typed at the command prompt and '''cont'''. | ||
| + | </gallery> | ||
| + | <gallery widths="765px" heights="37px" paddings="0px"> | ||
| + | File:Break.png|[<span style="color:#b60000">7</span>] If you see this, type '''o''' as shown and press enter on your keyboard. | ||
| + | </gallery> | ||
| + | |||
| + | =====NOTES for Unix users:===== | ||
Putty can be installed through your system's Package Manager. When installed, it is started from a command prompt window, by typing '''putty''' at the prompt. If you do not have a GUI, then install '''picocom''' through your system's Package Manager. | Putty can be installed through your system's Package Manager. When installed, it is started from a command prompt window, by typing '''putty''' at the prompt. If you do not have a GUI, then install '''picocom''' through your system's Package Manager. | ||
| Line 98: | Line 138: | ||
'''-d''' ..... databits (the default is 8, so this can be omitted). | '''-d''' ..... databits (the default is 8, so this can be omitted). | ||
| + | |||
| + | '''-c''' ..... echo to screen. | ||
| + | |||
| + | '''/dev/ttyS0''' ..... the serial port (equal to COM1 in Windows). | ||
'''tee''' ..... directs output to both the path and the screen. '''a''' appends the file (does not over-write the file). | '''tee''' ..... directs output to both the path and the screen. '''a''' appends the file (does not over-write the file). | ||
| Line 103: | Line 147: | ||
'''/root/debug.log''' ..... path to and name of the output file | '''/root/debug.log''' ..... path to and name of the output file | ||
| − | |||
| − | |||
| − | |||
| − | |||
| − | |||
| − | |||
| − | |||
| − | |||
| − | |||
| − | |||
| − | |||
| − | |||
| − | |||
| − | |||
| − | |||
| − | |||
| − | |||
| − | |||
| − | |||
| − | |||
| − | |||
| − | |||
| − | |||
| − | |||
| − | |||
| − | |||
| − | |||
| − | |||
| − | |||
| − | |||
| − | |||
| − | |||
| − | |||
| − | |||
| − | |||
| − | |||
| − | |||
| − | |||
| − | |||
| − | |||
| − | |||
| − | |||
| − | |||
| − | |||
| − | |||
| − | |||
| − | |||
| − | |||
| − | |||
| − | |||
| − | |||
| − | |||
| − | |||
| − | |||
| − | |||
| − | |||
| − | |||
| − | |||
| − | |||
| − | |||
| − | |||
| − | |||
| − | |||
| − | |||
| − | |||
| − | |||
| − | |||
| − | |||
| − | |||
| − | + | Stop and exit picocom with '''Ctrl+a''' followed by '''Ctrl+x'''. | |
| − | |||
| − | ==== | + | ===With a log file=== |
| + | The operating system needs to be installed for this to work, so stage one of the installation must be completed first. It then can be activated at the beginning of the second stage of the installation, by selecting '''ReactOS (Log file)''' at the boot screen. The debug log will be created in '''C:\reactos'''. | ||
| − | + | ===To the screen=== | |
| − | |||
| − | |||
| − | |||
| − | |||
| − | + | To activate debugging to the screen, just select '''ReactOS (Screen)''' at the boot screen. | |
| − | |||
| − | |||
| − | |||
| − | |||
| − | + | Debugging to the screen is normally only available from the boot screen, but can be activated for the first stage installation by altering txtsetup.sif; for details, see [[#Part three - More advanced debugging info|Part three - More advanced debugging info]]. | |
| − | |||
| − | |||
| − | |||
| − | === | + | === In a virtual machine === |
This section covers a simple VirtualBox setup using com0com or tty0tty as a virtual null modem cable to connect to Putty; all running on the same computer, no need for a real null modem cable and a second computer. | This section covers a simple VirtualBox setup using com0com or tty0tty as a virtual null modem cable to connect to Putty; all running on the same computer, no need for a real null modem cable and a second computer. | ||
| − | VirtualBox for Windows | + | VirtualBox for Windows and Unix, can be down loaded from https://www.virtualbox.org/ (plus installation help, should you need it), it is also available for Unix through your package manager. |
'''Note''' that for Unix, you will need to have the development package and the kernel source or header files installed. | '''Note''' that for Unix, you will need to have the development package and the kernel source or header files installed. | ||
| Line 206: | Line 170: | ||
'''Note:''' You may find it helpful if you name the virtual machine with a descriptive name, such as '''0.4.7-dev-582-g74cc915''' or '''ReactOS-g74cc915''' or '''ROS-0.4.6''', especially if you intend doing some serious debugging and having several virtual machines with different versions of ReactOS installed. | '''Note:''' You may find it helpful if you name the virtual machine with a descriptive name, such as '''0.4.7-dev-582-g74cc915''' or '''ReactOS-g74cc915''' or '''ROS-0.4.6''', especially if you intend doing some serious debugging and having several virtual machines with different versions of ReactOS installed. | ||
| − | There is another user's wiki | + | There is another user's wiki [[User:Matthiasbasler#Tutorial:_Getting_a_stable_software_stack_with_ReactOS_on_VirtualBox. | here]], which covers a more detailed setup for VirtualBox. |
====Windows - com0com==== | ====Windows - com0com==== | ||
| Line 239: | Line 203: | ||
====Testing com0com and tty0tty==== | ====Testing com0com and tty0tty==== | ||
| − | To test if it works, configure one instance of putty with '''CNCA0''' in Windows or '''/dev/pts/2''' in Unix and another instance of putty with '''CNCB0''' in Windows or '''/dev/pts/3''' in Unix, then run both | + | To test if it works, configure one instance of putty with '''CNCA0''' in Windows or '''/dev/pts/2''' in Unix and another instance of putty with '''CNCB0''' in Windows or '''/dev/pts/3''' in Unix, then run both instances of Putty and type into each Putty terminal window. If the input from each Putty terminal window is shown in the other Putty terminal window (what is typed into Putty No1 should display in Putty No2, also what is typed into Putty No2 should be displayed in Putty No1), then you have a working virtual null modem cable. |
Now you can run your VirtualBox virtual machine and install ReactOS. | Now you can run your VirtualBox virtual machine and install ReactOS. | ||
| Line 251: | Line 215: | ||
<gallery widths="451px" heights="391px" paddings="0px"> | <gallery widths="451px" heights="391px" paddings="0px"> | ||
File:Setup_for_com0com.png|[<span style="color:#b60000">8a</span>] Setup window for com0com. | File:Setup_for_com0com.png|[<span style="color:#b60000">8a</span>] Setup window for com0com. | ||
| − | File:tty0tty.png|[<span style="color:#b60000">8b</span>] | + | File:tty0tty.png|[<span style="color:#b60000">8b</span>] ?Starting tty0tty. |
</gallery> | </gallery> | ||
| Line 260: | Line 224: | ||
<gallery widths="654px" heights="429px" paddings="0px"> | <gallery widths="654px" heights="429px" paddings="0px"> | ||
| − | File:VirtualBox-Settings.png|[<span style="color:#b60000">10</span>] This is the Serial port settings window in VirtualBox. In the '''<u>P</u>ath/Address:''' it is '''\\.\CNCA0''' for '''com0com''' in Windows and '''/dev/pts/2''' for '''tty0tty''' in Unix. Depending on the version of VirtualBox, where you see '''<u>P</u>ath/Address:''' you could see '''Port/File Path:''' instead. | + | File:VirtualBox-Settings.png|[<span style="color:#b60000">10</span>] This is the Serial port settings window in VirtualBox. In the '''<u>P</u>ath/Address:''' it is '''\\.\CNCA0''' for '''com0com''' in Windows and '''/dev/pts/2''' for '''tty0tty''' in Unix. Depending on the version of VirtualBox, where you see '''<u>P</u>ath/Address:''' you could see '''Port/File Path:''' instead. |
</gallery> | </gallery> | ||
| Line 268: | Line 232: | ||
</gallery> | </gallery> | ||
| − | === | + | ==Section three - More advanced debugging info== |
| − | + | ||
| + | === The ReactOS debugger === | ||
| + | The ReactOS debugger has some commands that can be used from the command line; all of the commands are typed into the ReactOS test computer, but will be viewed in the terminal window (i.e putty) on the second computer. To enter a command, press the hotkey combination of '''Tab'''<small>+</small>'''k''', which halts the system and gives you the command prompt which looks like this: '''kdb:>''' where you can then enter the command. | ||
| + | |||
| + | ==== Debugger Commands: ==== | ||
| + | '''Tab'''<small>+</small>'''k''' - this key combination halts the system so you can enter commands into the debugger. | ||
| + | <br /> | ||
| + | '''bt''' - this command gives a backtrace; use it when ROS enters the debugger (see below). | ||
| + | <br /> | ||
| + | '''cont''' - this is short for continue. | ||
| + | <br /> | ||
| + | '''set condition <big><big>*</big></big> first always''' - this command tells ROS to enter the debugger on the first exception. | ||
| + | |||
| + | The following is an example of when ROS enters the debugger: | ||
| + | <br /> | ||
| + | <span style="color:#ffffff;background:#000000">Entered debugger on last-chance exception (Exception Code: 0xc0000001) (Unknown/User defined exception)<br />kdb></span> | ||
| + | |||
| + | You need to type '''bt''' to show/get a backtrace, when you see '''Entered debugger on last-chance exception''' as in the above example. | ||
| + | |||
| + | You may also see the following occasionaly:<br /> | ||
| + | <span style="color:#ffffff;background:#000000">Break repeatedly, break Once, Ignore, terminate Process or terminate Thread (boipt)?<br />kdb></span> | ||
| + | |||
| + | Explanation: | ||
| + | |||
| + | '''Break repeatedly''' - you enter '''<big>b</big>''' at the prompt. | ||
| + | |||
| + | '''break Once''' - you enter '''<big>o</big>''' at the prompt. | ||
| + | |||
| + | '''Ignore''' - you enter '''<big>i</big>''' at the prompt. | ||
| + | |||
| + | '''terminate Process''' - you enter '''<big>p</big>''' at the prompt. | ||
| + | |||
| + | '''terminate Thread''' - you enter '''<big>t</big>''' at the prompt. | ||
| + | |||
| + | '''(boipt)?''' - this is just a list of the commands. | ||
| + | |||
| + | '''Note''': Commands should be typed in lowercase. | ||
| + | |||
| + | Normally you would type '''o''' for break Once and keep typing it every time you see that line of options. | ||
| + | |||
| + | === Getting a backtrace: === | ||
| + | By looking in the Putty window, you will see when ROS enters the debugger, when that happens, you need to enter '''bt''' at the command prompt, like so: | ||
| + | '''kdb:> bt''' and press '''enter''' on the keyboard. | ||
| + | You may see this | ||
| + | <br /> | ||
| + | '''--- Press q to abort, any other key to continue ---''' | ||
| + | <br /> | ||
| + | If you do see it, then just press any key other than q, it may show again, just repeat until you are back at the command prompt of '''kdb:>''' | ||
| + | |||
| + | === Getting a more detailed backtrace by enabling 'First chance' === | ||
| + | To get more debug info, you need to set the debugger to halt the system every time an exception occurs, with the '''First chance''' switch. | ||
| + | |||
| + | Setting the condition to '''First chance''', will make ReactOS enter the debugger on every exception, which it may do many times, and each time you will have to type '''bt''' (to get a backtrace) then '''cont''' (to continue after getting the backtrace). | ||
| + | |||
| + | ====Within Freeloader==== | ||
| + | You may want to have the '''First chance''' start as soon as possible at boot time, so here is how to do that. | ||
| + | |||
| + | '''For serial debug''':<br>At the boot screen, select '''ReactOS (Debug)''' in the boot menu, then press '''F8''', then select '''Edit Boot Command Line (F10)''' at the next screen, then press the Enter key at the next screen (no need to alter anything). You should now see the screen shown below. | ||
| + | |||
| + | <div style="display:block;width:30em;height:auto;background:#000;padding:4.5em 5.5em;"> | ||
| + | <div style="display:block;width:27em;padding:0em 1em;background:#005599;color:#fff;border:2px solid #fff;"> | ||
| + | <p>Enter the options you want passed to the kernel. | ||
| + | <p>Examples:<br> | ||
| + | /DEBUG /DEBUGPORT=COM1 /BAUDRATE=115200<br> | ||
| + | /FASTDETECT /SOS /NOGUIBOOT<br> | ||
| + | /BASEVIDEO /MAXMEM=64<br> | ||
| + | /KERNEL=NTKRNLPM.EXE /HAL=HALMPS.DLL | ||
| + | <p> <span style="background:#000;color:#fff;">/DEBUG /DEBUGPORT=COM1 /BAUDRATE=115200 /SOS</span> | ||
| + | |||
| + | </div></div> | ||
| + | After the '''/SOS''' make a space, then enter '''/FIRSTCHANCE''' (note: there is a space between each option) and then press the Enter key and you will be back at the boot screen where you just press the Enter key to boot. | ||
| + | |||
| + | '''For debug to screen''':<br>You select '''ReactOS (Screen)''' at the boot screen and follow all the above steps as for serial, but the line to alter will show '''/DEBUG /DEBUGPORT=SCREEN /SOS''' and as above, just add '''/FIRSTCHANCE''' at the end. | ||
| + | |||
| + | ====Within the debugger==== | ||
| + | For all other times you can halt the debugger by pressing the hotkey combination of '''Tab'''<small>+</small>'''k''' on your keyboard, then type '''set condition <big><big>*</big></big> first always''' at the command prompt and press '''enter''' on the keyboard, then type '''cont''' and press '''enter''' on the keyboard. | ||
| + | |||
| + | '''Note''': If you are testing an app, then it is better to wait until you are ready to run the app, before setting the condition to first always. | ||
| + | |||
| + | ====Within freeldr.ini==== | ||
| + | '''freeldr.ini''' is located in '''C:\''' and can be edited to set '''first chance'''. Open it in a text editor and scroll down to the section '''[ReactOS_Debug]''' or '''[ReactOS_Screen]''' and add '''/FIRSTCHANCE''' to the end of the '''Options''' line. You then should have a line like this: | ||
| + | |||
| + | '''Options=/DEBUG /DEBUGPORT=COM1 /BAUDRATE=115200 /SOS /FIRSTCHANCE''' | ||
| + | |||
| + | or | ||
| + | |||
| + | '''Options=/DEBUG /DEBUGPORT=SCREEN /SOS /FIRSTCHANCE''' | ||
| + | |||
| + | This will be permanent until you either re-edit freeldr.ini or you re-install the OS. | ||
| + | |||
| + | Note: that '''[ReactOS_Debug]''' is associated with the boot menu '''ReactOS (Debug)''' and likewise, '''[ReactOS_Screen]''' is associated with the boot menu '''ReactOS (Screen)'''. So to use, you will have to select the appropriate one. | ||
| + | |||
| + | ====Usage suggestions==== <!-- I may remove this advice --> | ||
| + | Which method should you choose? To help you answer that question, here are some scenarios. | ||
| + | |||
| + | '''Freeloader''': | ||
| + | |||
| + | 1. You have successfully installed the first stage, but booting into the second stage it BSODs. | ||
| + | |||
| + | 2. You have successfully installed all stages and you have either installed some drivers or software; then the next time it is booting up, it BSODs. | ||
| + | |||
| + | '''Within the debugger''': | ||
| + | |||
| + | 1. You have installed some software that when you run it, it BSODs. | ||
| + | |||
| + | '''freeldr.ini''': | ||
| + | |||
| + | 1. When testing and you know that you will be doing a lot of re-boots. | ||
| + | |||
| + | '''txtsetup.sif''' (This is covered in it's own [[#Getting debug information in the first stage of installing ReactOS without needing a serial port|section]] below.) | ||
| + | |||
| + | 1. When you need to have first chance available from the start of stage one of the installation. | ||
| + | |||
| + | ===Debug to screen in the first stage=== <!-- this section needs attention --> | ||
| + | |||
| + | To get debug information in the first stage of the installation of ReactOS to show on the screen, you will need to modify a file called '''txtsetup.sif'''. There is no problem in the second stage of installation of reactOS, because there is a window which gives you a choice of modes that you can run in, you can then choose either Screen or Log File (which writes the debug log to '''C:\reactos'''). | ||
| + | |||
| + | ====Finding txtsetup.sif within the source code==== | ||
| + | |||
| + | If you compile your own source, then you will find '''txtsetup.sif''' in your source directory/folder, in '''\reactos\boot\bootdata\txtsetup.sif'''. | ||
| + | Example: '''E:\ReactOS_Development\Source\reactos\boot\bootdata\txtsetup.sif''' (see next image). | ||
| + | <gallery widths="708px" heights="243px"> | ||
| + | File:Source-setup-sif.png | ||
| + | </gallery> | ||
| + | |||
| + | ====Modifying txtsetup.sif==== | ||
| + | Open '''txtsetup.sif''' in a text editor and scroll down to find the section '''[SetupData]''' (see image below), | ||
| + | <gallery widths="616px" heights="112px"> | ||
| + | File:Txtsetup-in-editor.png|This shows the part of txtsetup.sif to alter, shown here in a text editor. | ||
| + | </gallery> | ||
| + | |||
| + | <gallery widths="622px" heights="98px"> | ||
| + | File:Txtsetup-sif.png|The altered version of txtsetup.sif | ||
| + | </gallery> | ||
| + | and comment out the line '''DbgOsLoadOptions = "/NOGUIBOOT /KDSERIAL /DEBUGPORT=COM1 /FIRSTCHANCE"''' by putting a semi-colon (''';''') at the front, then remove the semi-colon from the front of the line '''DbgOsLoadOptions = "/SOS /DEBUGPORT=SCREEN"''' as shown in the second image, just above, then save and compile. | ||
| + | |||
| + | When you boot ReactOS and it has loaded itself into memory, you will then see debug info streaming up the screen. | ||
| + | |||
| + | ====Finding txtsetup.sif within an ISO==== | ||
| + | =====Windows===== | ||
| + | Down load '''winiso-5''' from https://www.winiso.com/user/download/winiso-5.3.zip. | ||
| + | It comes with a trial version of the paid for winiso-6, which you may need because the free version, winiso-5, may not work. | ||
| + | |||
| + | In winiso-6 | ||
| + | |||
| + | 1. '''Open File''' (ISO). | ||
| + | |||
| + | 2. Navigate into the '''/reactos/''' directory | ||
| + | |||
| + | 3. '''Extract''' txtsetup.sif. | ||
| + | |||
| + | 4. Edit txtsetup.sif in a text editor and save (see Modifying txtsetup.sif). | ||
| + | |||
| + | 5. '''Add files''' and add it back, overwriting the original txtsetup.sif. | ||
| + | |||
| + | 6. '''Save'''. | ||
| + | |||
| + | 7. Burn to disc and boot it. | ||
| + | |||
| + | =====Unix===== | ||
| + | |||
| + | 1. Open the reactos ISO with '''ISO Master'''. | ||
| + | |||
| + | 2. Navigate into the '''/reactos/''' directory. | ||
| + | |||
| + | 3. '''Extract''' txtsetup.sif (I found the extracted file in my /home directory). | ||
| + | |||
| + | 4. Edit txtsetup.sif in a text editor and save (see Modifying txtsetup.sif). | ||
| + | |||
| + | 5. '''Remove''' the original txtsetup.sif in ISO Master. | ||
| + | |||
| + | 6. '''Add''' the altered txtsetup.sif back in ISO Master. | ||
| + | |||
| + | 7. '''Save File''', use another name for the ISO, because it will not overwrite the original. | ||
| + | |||
| + | 8. Burn the altered ISO to a disc and boot it. | ||
| + | |||
| + | |||
| + | '''A little more information''' with pictures can be found | ||
| + | [[User:Oldman/A layman's guide/Altering files in an ISO | here]] for both Unix and Windows. | ||
| + | |||
| + | ===Useful info and advice=== | ||
| + | |||
| + | * If when you use the ISO with the altered '''txtsetup.sif''' and it stops booting, just showing the command prompt '''kdb>''' at the top of the screen, with no debug info showing; then type '''bt''' and '''enter'''. This will display a back trace, which may then help the developers. | ||
| + | * '''Do not''' use '''Tab'''<small>+</small>'''k''' and '''bt''' to get a '''backtrace''', when ReactOS does not automatically enter the debugger! If you think by doing so, you will get some more useful information for the dev's to work with (which I have done in the past), you will not, it is a waste of time, the backtrace is of no value! | ||
| + | * Putty names the file putty.log, it would be a good idea to re-name it, because the next time that putty is run, it will over-write the file called "putty.log". I use something descriptive, in this format "'''''app name - ReactOS revision number'''''", for example "'''gimp-1.0.4 [0.4.7-dev-575-g48b2714]'''". | ||
| + | * If you find that when you use the test computer's keyboard to enter commands, nothing appears at the Command Prompt on the second (receiving) computer, then type the command on the second computer's keyboard, you then should see what you type appear at the Command Prompt. | ||
==Next step== | ==Next step== | ||
Latest revision as of 01:26, 19 April 2021
| A Layman's Guide |
|---|
|
By Oldman
|
This guide will show you how to get a debug log using the built in ReactOS debugger. There are several different ways to do this; they are:
Through the serial port. This is the best way; it captures all debug output from the moment it starts outputing.
With a log file. This is the least useful, due to the fact that it is saved to the hard drive and it first needs the OS to be installed.
To the screen. This is the second most useful way, you need to do some configuring to get debug info from the very start of stage one of the installation.
In a virtual machine using com0com (Windows) or tty0tty (unix) This uses a software serial port and is the best way when using a virtual machine.
Contents
- 1 Section one - General information
- 2 Section two - The different methods for getting a debug log
- 3 Section three - More advanced debugging info
- 4 Next step
Section one - General information
Debug ISOs
reactos-bootcd-0.4.7-dev-581-g9c790df-x86-gcc-lin-dbg.7z
reactos-livecd-0.4.7-dev-575-g48b2714-x86-gcc-lin-dbg.7z
reactos-bootcd-0.4.7-dev-575-g48b2714-x86-msvc-win-dbg.7z
reactos-livecd-0.4.7-dev-575-g48b2714-x86-msvc-win-dbg.7z
reactos-livecd-0.4.15-dev-147-g633770a-x64-msvc-win-dbg.7z
Explanation:
reactos-bootcd - 0.4.7 - dev - 581-g9c790df - x86-gcc-lin-dbg.7z
reactos-bootcd = type of ISO (boot for installing, live for running OS without installing).
0.4.7 = The number of the next release. The number changes every time a release branch is created, so when the 0.4.7 was branched for release, the number on the daily/latest ISOs became 0.4.8. And when the 0.4.8 was branched for release, the number on the daily/latest ISOs became 0.4.9. Now the 0.4.9 is branched, the number on the daily/lastest ISOs are numbered 0.4.10.
dev = development
581-g9c790df = identifies the commit and the committer.
x86-gcc-lin-dbg = x86 (32bit OS) - gcc (compiler) - lin (built using Linux) - dbg (debug build)
reactos-bootcd-0.4.7-dev-575-g48b2714-x86-msvc-win-dbg.7z
msvc-win = msvc (compiler) - win (built using Windows)
For normal users, the ISOs built with gcc are the ones to go for. You may need a copy of MSVC to make full use of the msvc-win builds.
x64 = the 64 bit version. Only available (currently) from the Latest Builds page and they are of no real value yet. There are NO official Release builds yet.
Stages of the installation of ReactOS
It may be helpful to understand the stages of the installation of ReactOS.
First stage:
When the installation CD (bootcd) is run, the bootloader asks you to press any key to install.
The OS will first load itself into memory, then you are presented with the Language setup window, then 2 more windows, then Device settings window, then choose Hard drive partition window, then format window, then confirm format window. then choose directory window. then 2 more windows, then bootloader choice window. In the last window you are asked to remove media and press Enter. The computer now reboots.
Second stage:
The bootloader shows the Boot options choice window, then boots, loads device drivers, then shows the setup window, after that there are more configuration windows (when testing you can press Enter at all these windows), before it finally reboots.
Third stage:
It now boots up into desktop and displays the driver install wizard, if it finds any hardware without a driver.
NOTE:
Debug output only starts when the OS is loaded into memory, but just before it loads the drivers.
When installing (First stage), debug output is turned on by default and can only be captured through a null modem serial cable connect to a second computer (to alter this default, see this section), but once ReactOS is installed (Second stage and normal usage), you will have a choice of how to record debug output, from the boot menu. See [1] ReactOS boot options menu in Screenshots section in Part two below.
Section two - The different methods for getting a debug log
Through the serial port
Hardware requirements:
- A test computer with a serial port.
- A second computer with a serial port and Putty installed (or similar app).
- A nullmodem cable to connect both computers.
Software
Win32 Putty - http://www.chiark.greenend.org.uk/~sgtatham/putty/download.html You will also find the source code for Windows and Unix at this link, but Unix users may be able to get Putty through their Package Manager (see NOTES for Unix users).
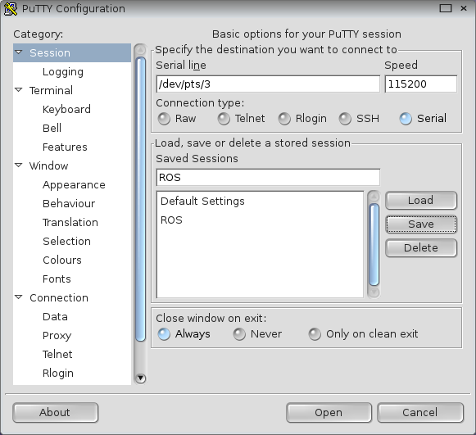
Setting up Putty.
There are some vital settings in Putty, which need to be set, so that Putty can capture a debug log.
In putty go to Category and select Session, then set the following inputs to these values:
Serial line = COM1 (ttyS0 for Unix)
Speed = 115200
Connection type = Serial
Back to Category and select Logging, in Session logging: check All session output. Note where Putty saves the log file and change if required; use the Browse button for the destination folder.
See in Screenshots [2] [3] below for visual information.
Save the above changes in putty, with a name of your choice, in Saved Sessions, then use the Save button. It can then be loaded the next time you use Putty, by using the Load button. Note: logging is started by using the Open button.
Screenshots
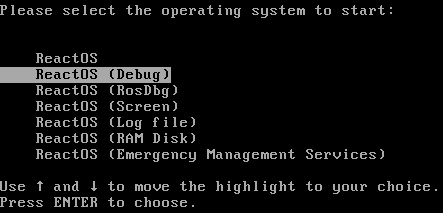
[1] ReactOS boot options menu.


[2] PuTTY Configuration - Session

[3] PuTTY Configuration - Logging


[4] Ros in the debugger showing bt entered at the command prompt.

[5] You may see this after entering bt and after the debug info has stopped.

[6] The debugger has been entered manually and shows set condition * first always typed at the command prompt and cont.

[7] If you see this, type o as shown and press enter on your keyboard.
NOTES for Unix users:
Putty can be installed through your system's Package Manager. When installed, it is started from a command prompt window, by typing putty at the prompt. If you do not have a GUI, then install picocom through your system's Package Manager.
picocom settings
picocom -b 115200 -f x -p n -d 8 -c /dev/ttyS0 | tee -a /root/debug.log
Explanation:
picocom ..... starts the application.
-b ..... baud rate.
-f ..... flow control. x = Xon Xoff.
-p ..... parity. n = none.
-d ..... databits (the default is 8, so this can be omitted).
-c ..... echo to screen.
/dev/ttyS0 ..... the serial port (equal to COM1 in Windows).
tee ..... directs output to both the path and the screen. a appends the file (does not over-write the file).
/root/debug.log ..... path to and name of the output file
Stop and exit picocom with Ctrl+a followed by Ctrl+x.
With a log file
The operating system needs to be installed for this to work, so stage one of the installation must be completed first. It then can be activated at the beginning of the second stage of the installation, by selecting ReactOS (Log file) at the boot screen. The debug log will be created in C:\reactos.
To the screen
To activate debugging to the screen, just select ReactOS (Screen) at the boot screen.
Debugging to the screen is normally only available from the boot screen, but can be activated for the first stage installation by altering txtsetup.sif; for details, see Part three - More advanced debugging info.
In a virtual machine
This section covers a simple VirtualBox setup using com0com or tty0tty as a virtual null modem cable to connect to Putty; all running on the same computer, no need for a real null modem cable and a second computer.
VirtualBox for Windows and Unix, can be down loaded from https://www.virtualbox.org/ (plus installation help, should you need it), it is also available for Unix through your package manager.
Note that for Unix, you will need to have the development package and the kernel source or header files installed.
Install VirtualBox for your operating system, then start it. You will first need to create a virtual machine to install ReactOS into; this is done by clicking on the blue New button. In the first setup window you will need to give it a name in Name:, then set it to Microsoft Windows in Type: and then set it to, either WindowsXP(32bit) or Windows 2003(32 bit) in Version:, then for a simple setup, you can accept all the defaults in all the other setup windows (I alter just one item, I select VHD (Virtual Hard Disk) in the last setup window). There is no need to install ReactOS into the virtual machine just yet, if you want to log the debug output from the start of an installation.
Note: You may find it helpful if you name the virtual machine with a descriptive name, such as 0.4.7-dev-582-g74cc915 or ReactOS-g74cc915 or ROS-0.4.6, especially if you intend doing some serious debugging and having several virtual machines with different versions of ReactOS installed.
There is another user's wiki here, which covers a more detailed setup for VirtualBox.
Windows - com0com
Get the latest com0com from https://sourceforge.net/projects/com0com/files/com0com/ and install it. Then run setup [8a], click on the Add Pair button, which creates a pair of virtual ports, then click on the Apply button. There is no need to tick any of the tick boxes.
In the setup window you will see CNCA0 and CNCB0 which are the newly created virtual ports [8] (If you should ever have the need to add more virtual ports, then the next pair will be CNCA1 and CNCB1). The CNCA0 is used in the Path/Address: in VirtualBox virtual machine serial configuration [10] in this format \\.\CNCA0 and the CNCB0 is used in the Serial line in the Putty serial configuration [11a] just as it is.
The com0com virtual ports process remains until you use the Remove button in the setup app, to remove them.
Unix - tty0tty
You can get tty0tty from https://sourceforge.net/projects/tty0tty/files/ (the latest is currently tty0tty-1.2).
Unpack the package tty0tty-1.2tgz to a folder; my OS was able to unpack it to /tty0tty-1.2/, just by clicking on the package.
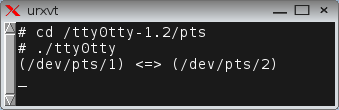
It requires compiling, so navigate to the directory /tty0tty-1.2/pts (cd /tty0tty-1.2/pts) and open a terminal window (right click - Window - Terminal here). At the command prompt type make and shortly you should have an executable file in the pts folder. Then still within the pts folder/directory, type ./tty0tty at the command prompt to run [8b]. The output could be
(/dev/pts/1) <=> (/dev/pts/2)
or
(/dev/pts/2) <=> (/dev/pts/3)
it may vary. But whatever the left side is, such as /dev/pts/2 will be entered into the Path/Address: in the VirtualBox virtual machine's serial configuration [10] and whatever the right side is, such as /dev/pts/3 will be entered into the Serial line in the Putty Serial configuration, instead of the default com or tty [11b].
I end the tty0tty virtual ports process, by using the Ctrl - c combination, but I would expect it to terminate when the terminal window is closed.
There is another folder in the directory /tty0tty-1.2/module which also requires compiling. This will, when run, create several pairs of virtual ports, which remain until the OS is re-installed or upgraded. I have not used it or included it within this tutorial.
Testing com0com and tty0tty
To test if it works, configure one instance of putty with CNCA0 in Windows or /dev/pts/2 in Unix and another instance of putty with CNCB0 in Windows or /dev/pts/3 in Unix, then run both instances of Putty and type into each Putty terminal window. If the input from each Putty terminal window is shown in the other Putty terminal window (what is typed into Putty No1 should display in Putty No2, also what is typed into Putty No2 should be displayed in Putty No1), then you have a working virtual null modem cable.
Now you can run your VirtualBox virtual machine and install ReactOS.
Note: When you run your virtual machine with an installed OS, then make sure that there is no bootable media in any of your external drives (floppy, USB or CD/DVD), else the VirtualBox virtual machine will boot it instead of the installed OS.
Now you can refer back to #The_ReactOS_debugger
Screenshots

[8a] Setup window for com0com.
[8b] ?Starting tty0tty.


[9] This is the main window in VirtualBox. It looks the same in both Unix and Windows. Use the New button to create a new virtual machine, the Settings button to add or alter settings (select the virtual machine first) and the Start button starts the selected virtual machine.

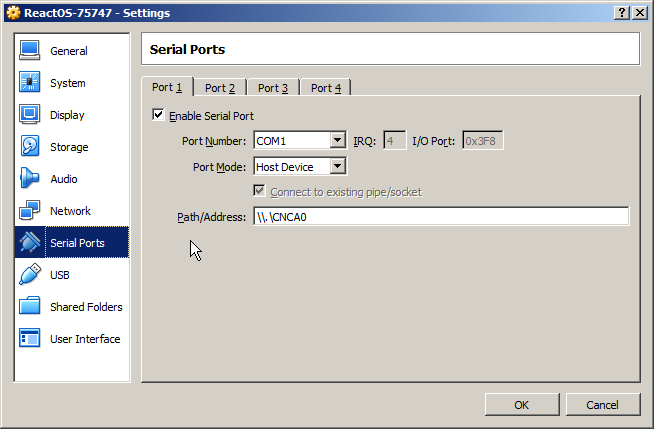
[10] This is the Serial port settings window in VirtualBox. In the Path/Address: it is \\.\CNCA0 for com0com in Windows and /dev/pts/2 for tty0tty in Unix. Depending on the version of VirtualBox, where you see Path/Address: you could see Port/File Path: instead.

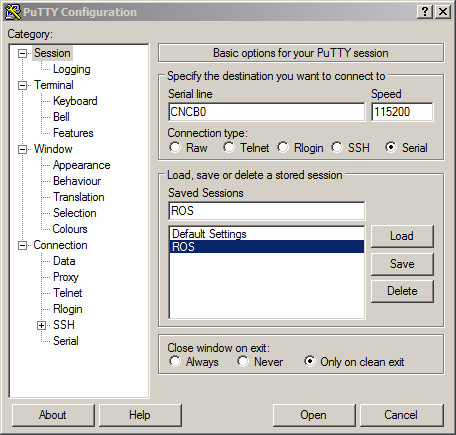
[11a] Windows com0com Putty Serial configuration.
[11b] Unix tty0tty Putty Serial configuration.


Section three - More advanced debugging info
The ReactOS debugger
The ReactOS debugger has some commands that can be used from the command line; all of the commands are typed into the ReactOS test computer, but will be viewed in the terminal window (i.e putty) on the second computer. To enter a command, press the hotkey combination of Tab+k, which halts the system and gives you the command prompt which looks like this: kdb:> where you can then enter the command.
Debugger Commands:
Tab+k - this key combination halts the system so you can enter commands into the debugger.
bt - this command gives a backtrace; use it when ROS enters the debugger (see below).
cont - this is short for continue.
set condition * first always - this command tells ROS to enter the debugger on the first exception.
The following is an example of when ROS enters the debugger:
Entered debugger on last-chance exception (Exception Code: 0xc0000001) (Unknown/User defined exception)
kdb>
You need to type bt to show/get a backtrace, when you see Entered debugger on last-chance exception as in the above example.
You may also see the following occasionaly:
Break repeatedly, break Once, Ignore, terminate Process or terminate Thread (boipt)?
kdb>
Explanation:
Break repeatedly - you enter b at the prompt.
break Once - you enter o at the prompt.
Ignore - you enter i at the prompt.
terminate Process - you enter p at the prompt.
terminate Thread - you enter t at the prompt.
(boipt)? - this is just a list of the commands.
Note: Commands should be typed in lowercase.
Normally you would type o for break Once and keep typing it every time you see that line of options.
Getting a backtrace:
By looking in the Putty window, you will see when ROS enters the debugger, when that happens, you need to enter bt at the command prompt, like so:
kdb:> bt and press enter on the keyboard.
You may see this
--- Press q to abort, any other key to continue ---
If you do see it, then just press any key other than q, it may show again, just repeat until you are back at the command prompt of kdb:>
Getting a more detailed backtrace by enabling 'First chance'
To get more debug info, you need to set the debugger to halt the system every time an exception occurs, with the First chance switch.
Setting the condition to First chance, will make ReactOS enter the debugger on every exception, which it may do many times, and each time you will have to type bt (to get a backtrace) then cont (to continue after getting the backtrace).
Within Freeloader
You may want to have the First chance start as soon as possible at boot time, so here is how to do that.
For serial debug:
At the boot screen, select ReactOS (Debug) in the boot menu, then press F8, then select Edit Boot Command Line (F10) at the next screen, then press the Enter key at the next screen (no need to alter anything). You should now see the screen shown below.
Enter the options you want passed to the kernel.
Examples:
/DEBUG /DEBUGPORT=COM1 /BAUDRATE=115200
/FASTDETECT /SOS /NOGUIBOOT
/BASEVIDEO /MAXMEM=64
/KERNEL=NTKRNLPM.EXE /HAL=HALMPS.DLL
/DEBUG /DEBUGPORT=COM1 /BAUDRATE=115200 /SOS
After the /SOS make a space, then enter /FIRSTCHANCE (note: there is a space between each option) and then press the Enter key and you will be back at the boot screen where you just press the Enter key to boot.
For debug to screen:
You select ReactOS (Screen) at the boot screen and follow all the above steps as for serial, but the line to alter will show /DEBUG /DEBUGPORT=SCREEN /SOS and as above, just add /FIRSTCHANCE at the end.
Within the debugger
For all other times you can halt the debugger by pressing the hotkey combination of Tab+k on your keyboard, then type set condition * first always at the command prompt and press enter on the keyboard, then type cont and press enter on the keyboard.
Note: If you are testing an app, then it is better to wait until you are ready to run the app, before setting the condition to first always.
Within freeldr.ini
freeldr.ini is located in C:\ and can be edited to set first chance. Open it in a text editor and scroll down to the section [ReactOS_Debug] or [ReactOS_Screen] and add /FIRSTCHANCE to the end of the Options line. You then should have a line like this:
Options=/DEBUG /DEBUGPORT=COM1 /BAUDRATE=115200 /SOS /FIRSTCHANCE
or
Options=/DEBUG /DEBUGPORT=SCREEN /SOS /FIRSTCHANCE
This will be permanent until you either re-edit freeldr.ini or you re-install the OS.
Note: that [ReactOS_Debug] is associated with the boot menu ReactOS (Debug) and likewise, [ReactOS_Screen] is associated with the boot menu ReactOS (Screen). So to use, you will have to select the appropriate one.
Usage suggestions
Which method should you choose? To help you answer that question, here are some scenarios.
Freeloader:
1. You have successfully installed the first stage, but booting into the second stage it BSODs.
2. You have successfully installed all stages and you have either installed some drivers or software; then the next time it is booting up, it BSODs.
Within the debugger:
1. You have installed some software that when you run it, it BSODs.
freeldr.ini:
1. When testing and you know that you will be doing a lot of re-boots.
txtsetup.sif (This is covered in it's own section below.)
1. When you need to have first chance available from the start of stage one of the installation.
Debug to screen in the first stage
To get debug information in the first stage of the installation of ReactOS to show on the screen, you will need to modify a file called txtsetup.sif. There is no problem in the second stage of installation of reactOS, because there is a window which gives you a choice of modes that you can run in, you can then choose either Screen or Log File (which writes the debug log to C:\reactos).
Finding txtsetup.sif within the source code
If you compile your own source, then you will find txtsetup.sif in your source directory/folder, in \reactos\boot\bootdata\txtsetup.sif. Example: E:\ReactOS_Development\Source\reactos\boot\bootdata\txtsetup.sif (see next image).

Modifying txtsetup.sif
Open txtsetup.sif in a text editor and scroll down to find the section [SetupData] (see image below),
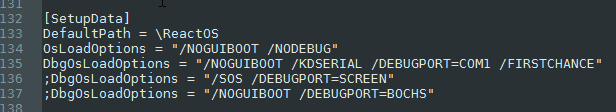
This shows the part of txtsetup.sif to alter, shown here in a text editor.


The altered version of txtsetup.sif

and comment out the line DbgOsLoadOptions = "/NOGUIBOOT /KDSERIAL /DEBUGPORT=COM1 /FIRSTCHANCE" by putting a semi-colon (;) at the front, then remove the semi-colon from the front of the line DbgOsLoadOptions = "/SOS /DEBUGPORT=SCREEN" as shown in the second image, just above, then save and compile.
When you boot ReactOS and it has loaded itself into memory, you will then see debug info streaming up the screen.
Finding txtsetup.sif within an ISO
Windows
Down load winiso-5 from https://www.winiso.com/user/download/winiso-5.3.zip. It comes with a trial version of the paid for winiso-6, which you may need because the free version, winiso-5, may not work.
In winiso-6
1. Open File (ISO).
2. Navigate into the /reactos/ directory
3. Extract txtsetup.sif.
4. Edit txtsetup.sif in a text editor and save (see Modifying txtsetup.sif).
5. Add files and add it back, overwriting the original txtsetup.sif.
6. Save.
7. Burn to disc and boot it.
Unix
1. Open the reactos ISO with ISO Master.
2. Navigate into the /reactos/ directory.
3. Extract txtsetup.sif (I found the extracted file in my /home directory).
4. Edit txtsetup.sif in a text editor and save (see Modifying txtsetup.sif).
5. Remove the original txtsetup.sif in ISO Master.
6. Add the altered txtsetup.sif back in ISO Master.
7. Save File, use another name for the ISO, because it will not overwrite the original.
8. Burn the altered ISO to a disc and boot it.
A little more information with pictures can be found
here for both Unix and Windows.
Useful info and advice
- If when you use the ISO with the altered txtsetup.sif and it stops booting, just showing the command prompt kdb> at the top of the screen, with no debug info showing; then type bt and enter. This will display a back trace, which may then help the developers.
- Do not use Tab+k and bt to get a backtrace, when ReactOS does not automatically enter the debugger! If you think by doing so, you will get some more useful information for the dev's to work with (which I have done in the past), you will not, it is a waste of time, the backtrace is of no value!
- Putty names the file putty.log, it would be a good idea to re-name it, because the next time that putty is run, it will over-write the file called "putty.log". I use something descriptive, in this format "app name - ReactOS revision number", for example "gimp-1.0.4 [0.4.7-dev-575-g48b2714]".
- If you find that when you use the test computer's keyboard to enter commands, nothing appears at the Command Prompt on the second (receiving) computer, then type the command on the second computer's keyboard, you then should see what you type appear at the Command Prompt.
Next step
Read How to create a JIRA Issue for reporting bugs.